
This is an exact analogy to a clever, insightful and astonishingly simple recent technique for calibrating the stiffness of an optical tweezer, the force-well formed by a tightly focused laser beam which is used to trap, manipulate and track microscopic dielectric beads in fluid-filled micro-chambers in single-molecule biophysics. The coated beads can be hitched to molecular motors and DNA molecules, allowing the machinery of life to be illuminated.
Clearly, in order for an optical tweezer to be a quantitative tool, its force characteristics must be known. One classical technique for calibrating a trap is to sweep the fluid chamber at constant velocity, back and forth, and observe the deviation of a trapped bead as the fluid drags it. The trap force can be calculated by applying Stokes’ familiar hydrodynamic equation to the observed deflection of the bead.
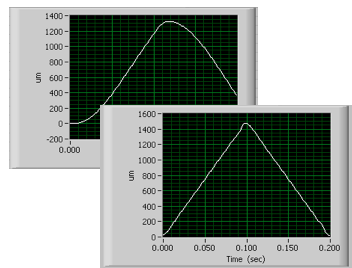 |
| Dynamic Digital Linearization enables Stokes calibration of optical tweezers by eliminating following errors. |
But back to our punching-bag. Reduce it to the nanoscale, and it is our dielectric bead. The pummeling boxer is Brownian motion, and his slight side-to-side sway is a nanoscale, sinusoidal position waveform applied to the fluid chamber by the piezoelectric microscope stage. The spring is the optical trap.
If this can serve, then several advantages emerge versus the Stokes-calibration approach. First, the sinusoidal waveform is a single frequency and can be selected to avoid driving structural resonances in the microscope assembly that might otherwise be problematic given the high-frequency Fourier components of the sharp-cornered triangle wave used in Stokes calibration. Its amplitude is very small. No constant-velocity region is required, and moderate following errors and rolloff are no issue since all needs to be known is the position-waveform amplitude in all axes, which a parallel-kinematic stage with direct motion metrology can provide. And the analysis can be performed entirely in the frequency domain using the positional trace of the bead. Brilliant!
 |
| From Fig. 2 of the Tolić-Nørrelykke paper, showing the power spectral density of the bead's motion. |
As an aside, there is a tantalizing resemblance between this PSD and the frequency-domain plot sometimes proffered as illustrating the positional resolution of some nanopositioning devices. The difference is that this plot comes from actual motion data, not sensors indirectly inferring position via flexural strain deep in the mechanics. (One could immobilize the platform of such a stage, and the sensors would still see strains as the piezos actuate.) And the plot floor also represents actual limits—in this case, the inescapable Brownian motion of the bead—rather than filtered electrical strain-sensor noise, which is sometimes hyped to imply sub-picometer positional stability that is, unfortunately, not a possibility in the real-world ambient environment of any laboratory on Earth. At the nano scale, we’re all punching bags.
(The author would like to thank Armin Hoffmann of the University of Alberta for bringing the Tolić-Nørrelykke paper to our attention.)